Status Bar
The Status Bar gives you direct access to useful tools you may need throughout your workflow.

The left half shows you status messages, while the right half contains the following tools.
Tools
Screenshot
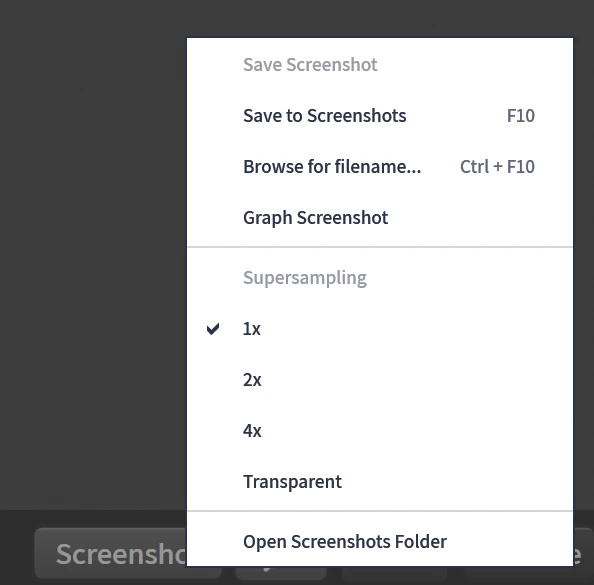
The Screenshot button lets you quickly take screenshots of the viewport.
Clicking the button will take an "auto screenshot" of the viewport. The screenshot is named after your current open file and suffixed with a timestamp and saved in the Gaea Screenshot folder (eg: RockyTerrain_2022-11-10_23-00-32.png).
Right-clicking the button gives you screenshot options. You can choose to save a screenshot to a specific location and filename, or take a screenshot of the graph instead of the viewport.
The Supersampling option allows you to double or quadruple your screenshots resolution. For example, if you are on a 4K display, a 4x supersampled screenshot will be 12K in size.
The supersampling occurs in realtime on the GPU and provides maximum fidelity to show off your terrains. 2K and 4K supersampling look fantastic with 4096 x 4096 previews.
In addition, you can choose to have a transparent background in the screenshot.
Height Picker
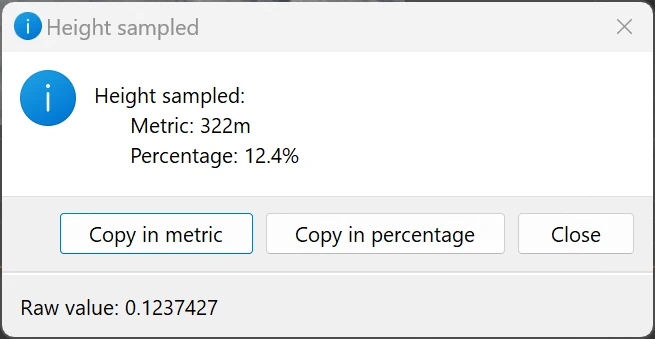
The Height Picker lets you sample any location on the current terrain view and tell you the altitude in meters, percentage, and raw 32-bit floating point value.
Suspend Engine
Suspend Engine allows you disable all graph processing. This is useful when you want to make multiple changes and don't want the nodes to update unnecessarily. For example, if you wish to make multiple connections or change several settings across one or more nodes. You can suspend the engine, make the changes, then resume it.
This can be toggled with the keyboard shortcut `.
Passive Optimizer
The Passive Optimizer runs garbage collection and other memory optimizations in the background. It will offload cached viewport previews and other minor data that has not been accessed in a while. It is recommended that this be kept on at all times. This toggle is provided for advanced cases where you may need to stop memory optimization for testing purposes, or if you wish to retain memory at all times.
Build Statistics
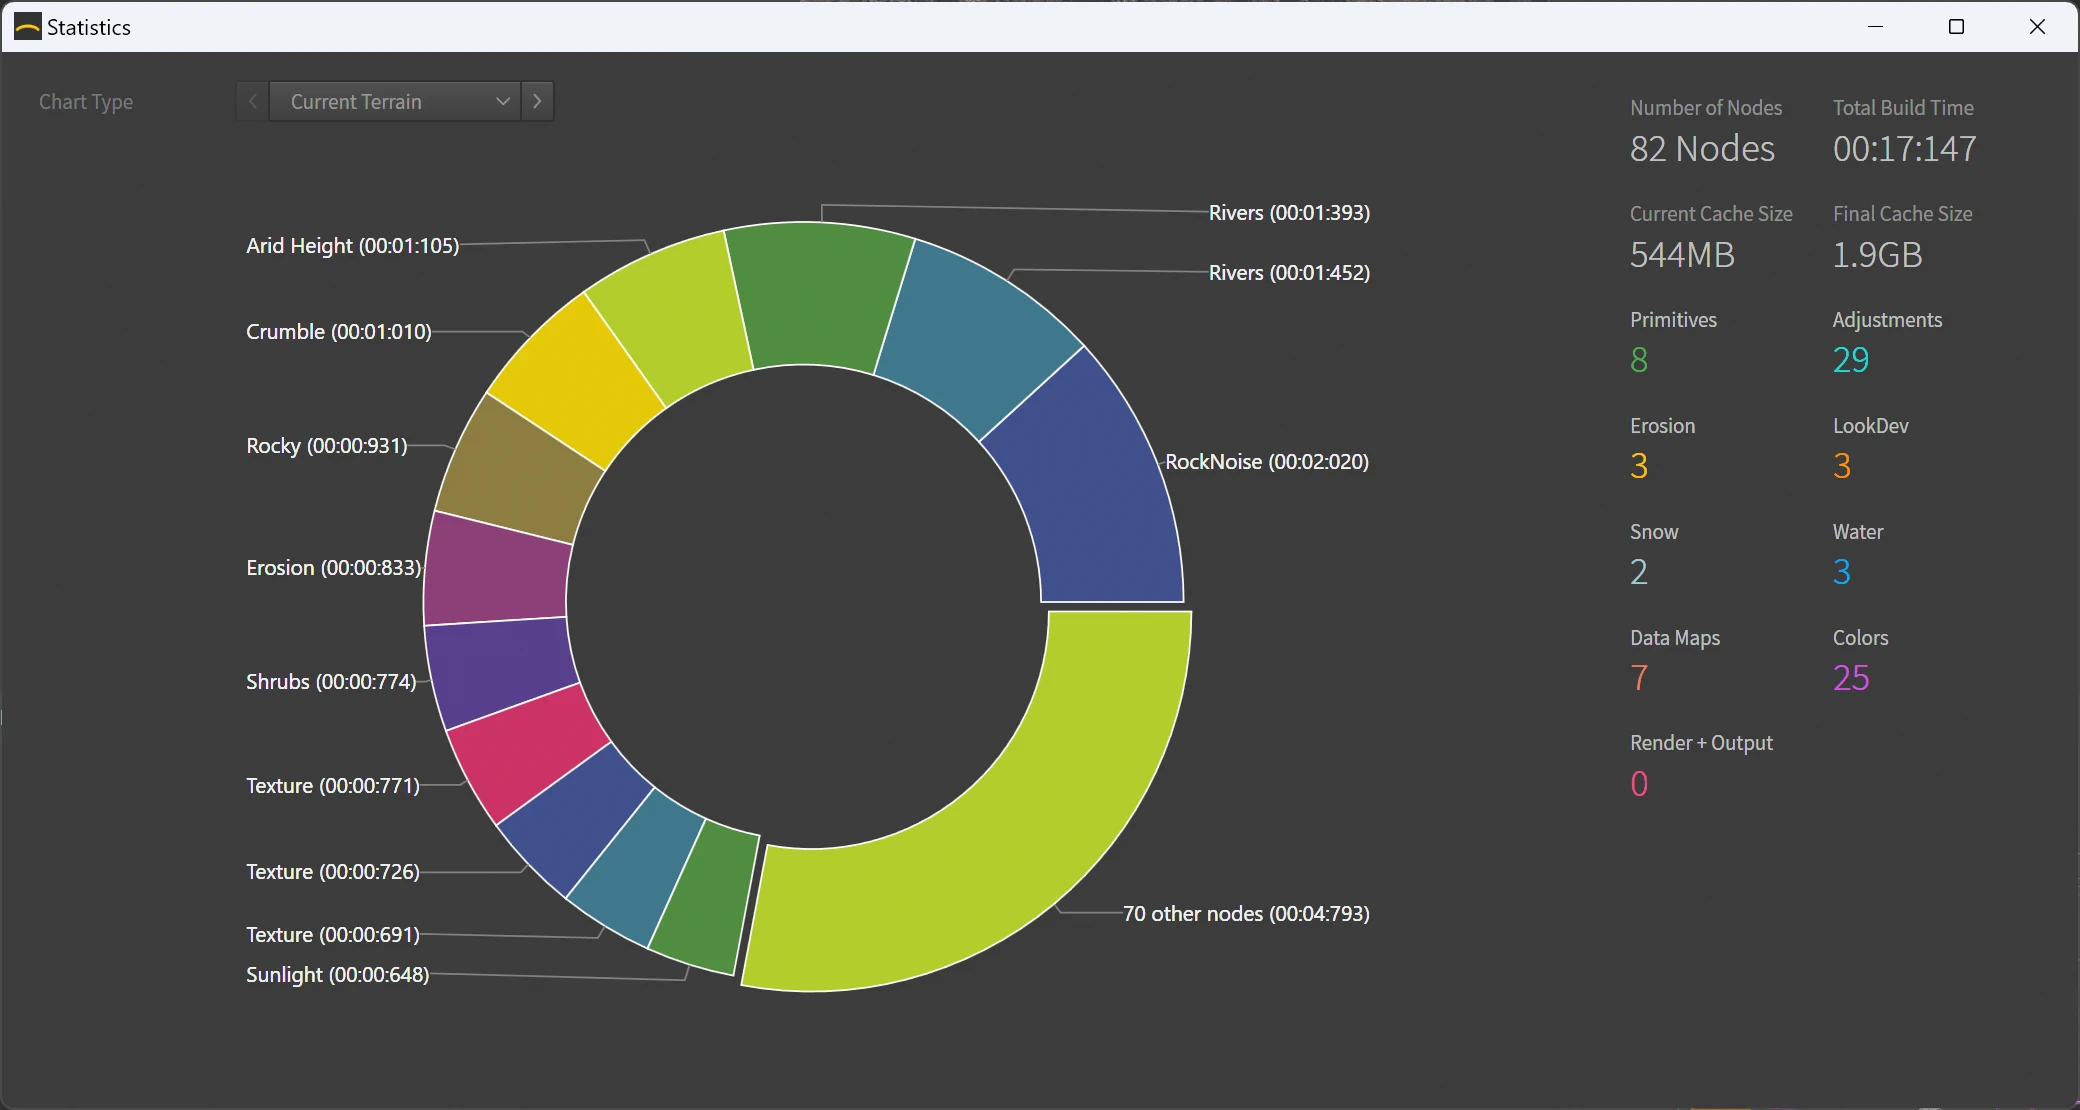
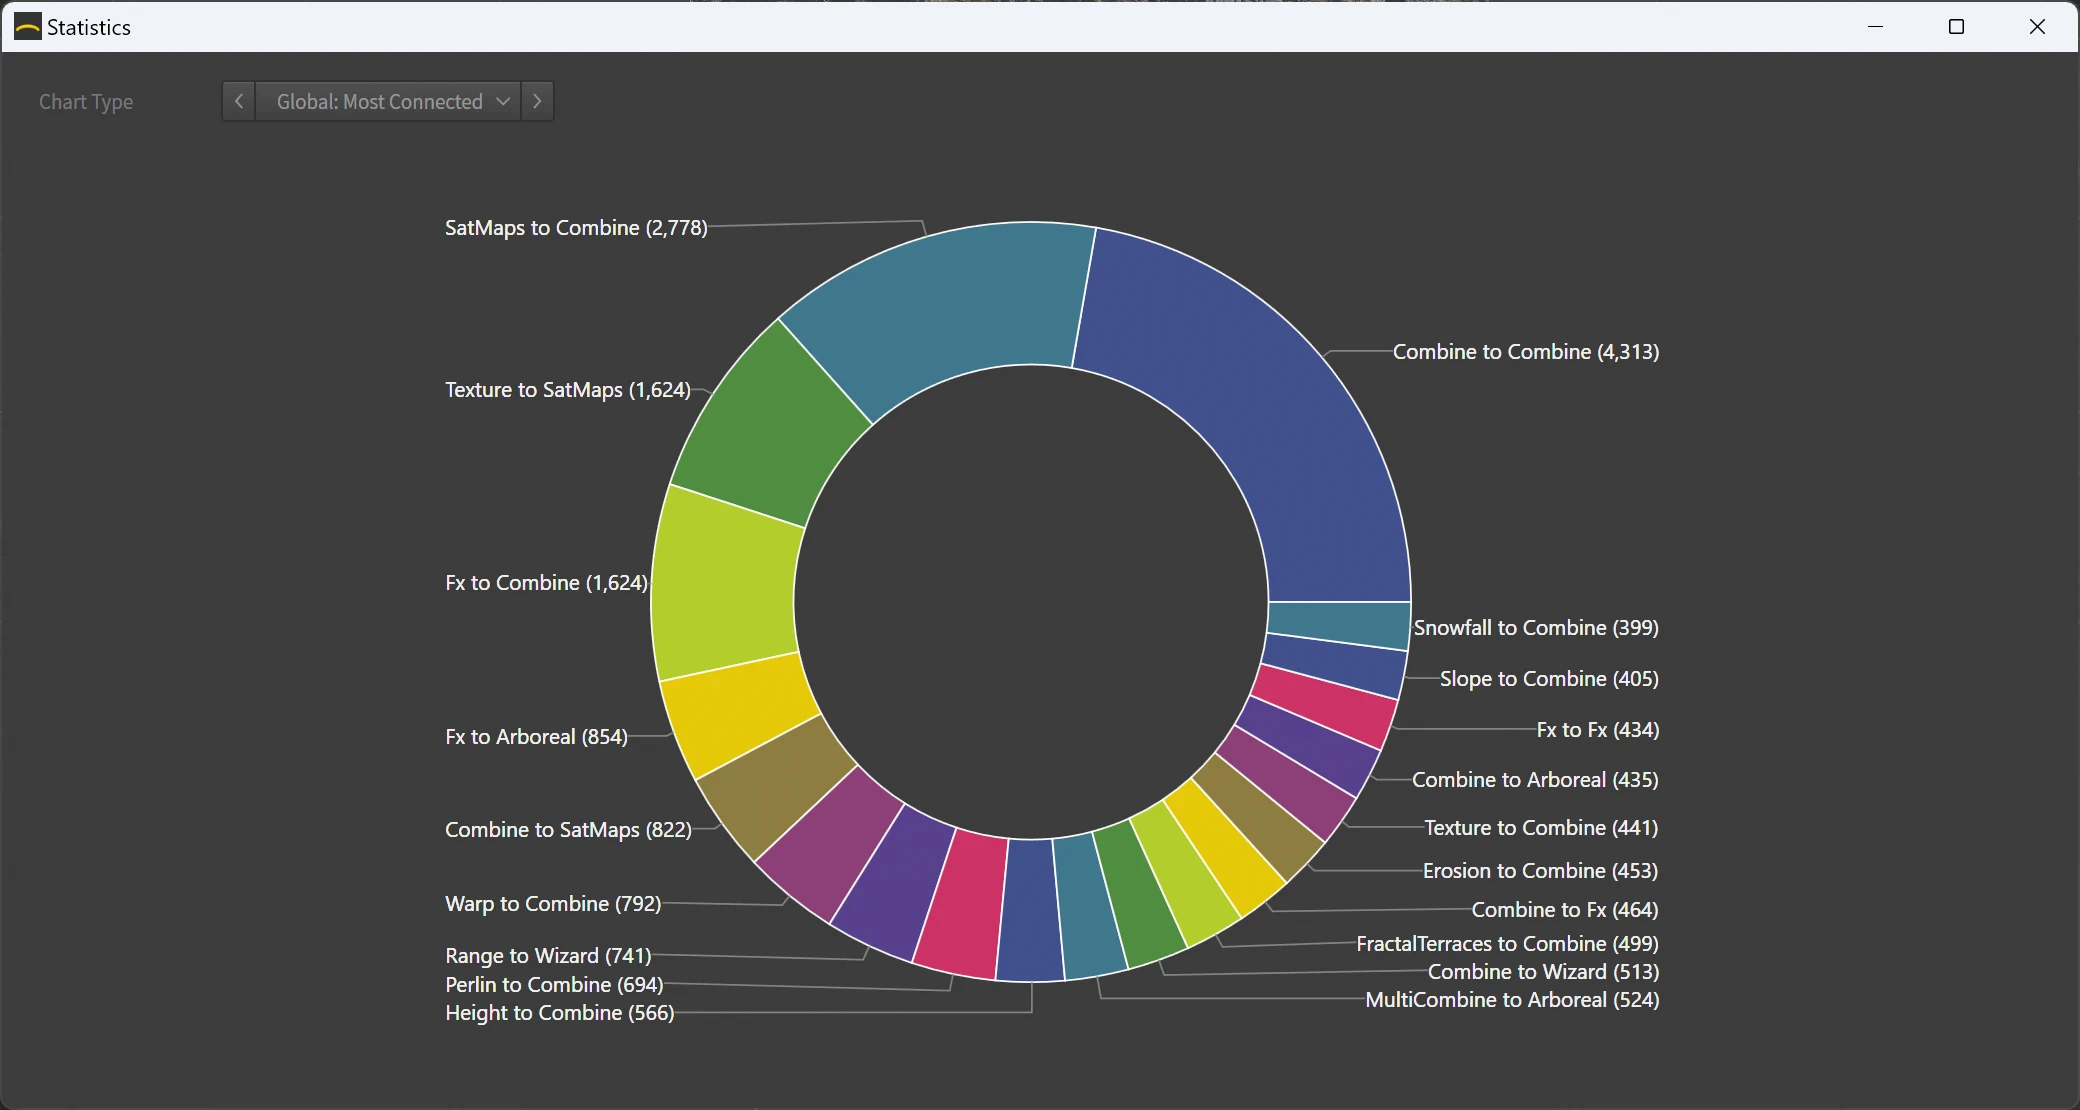
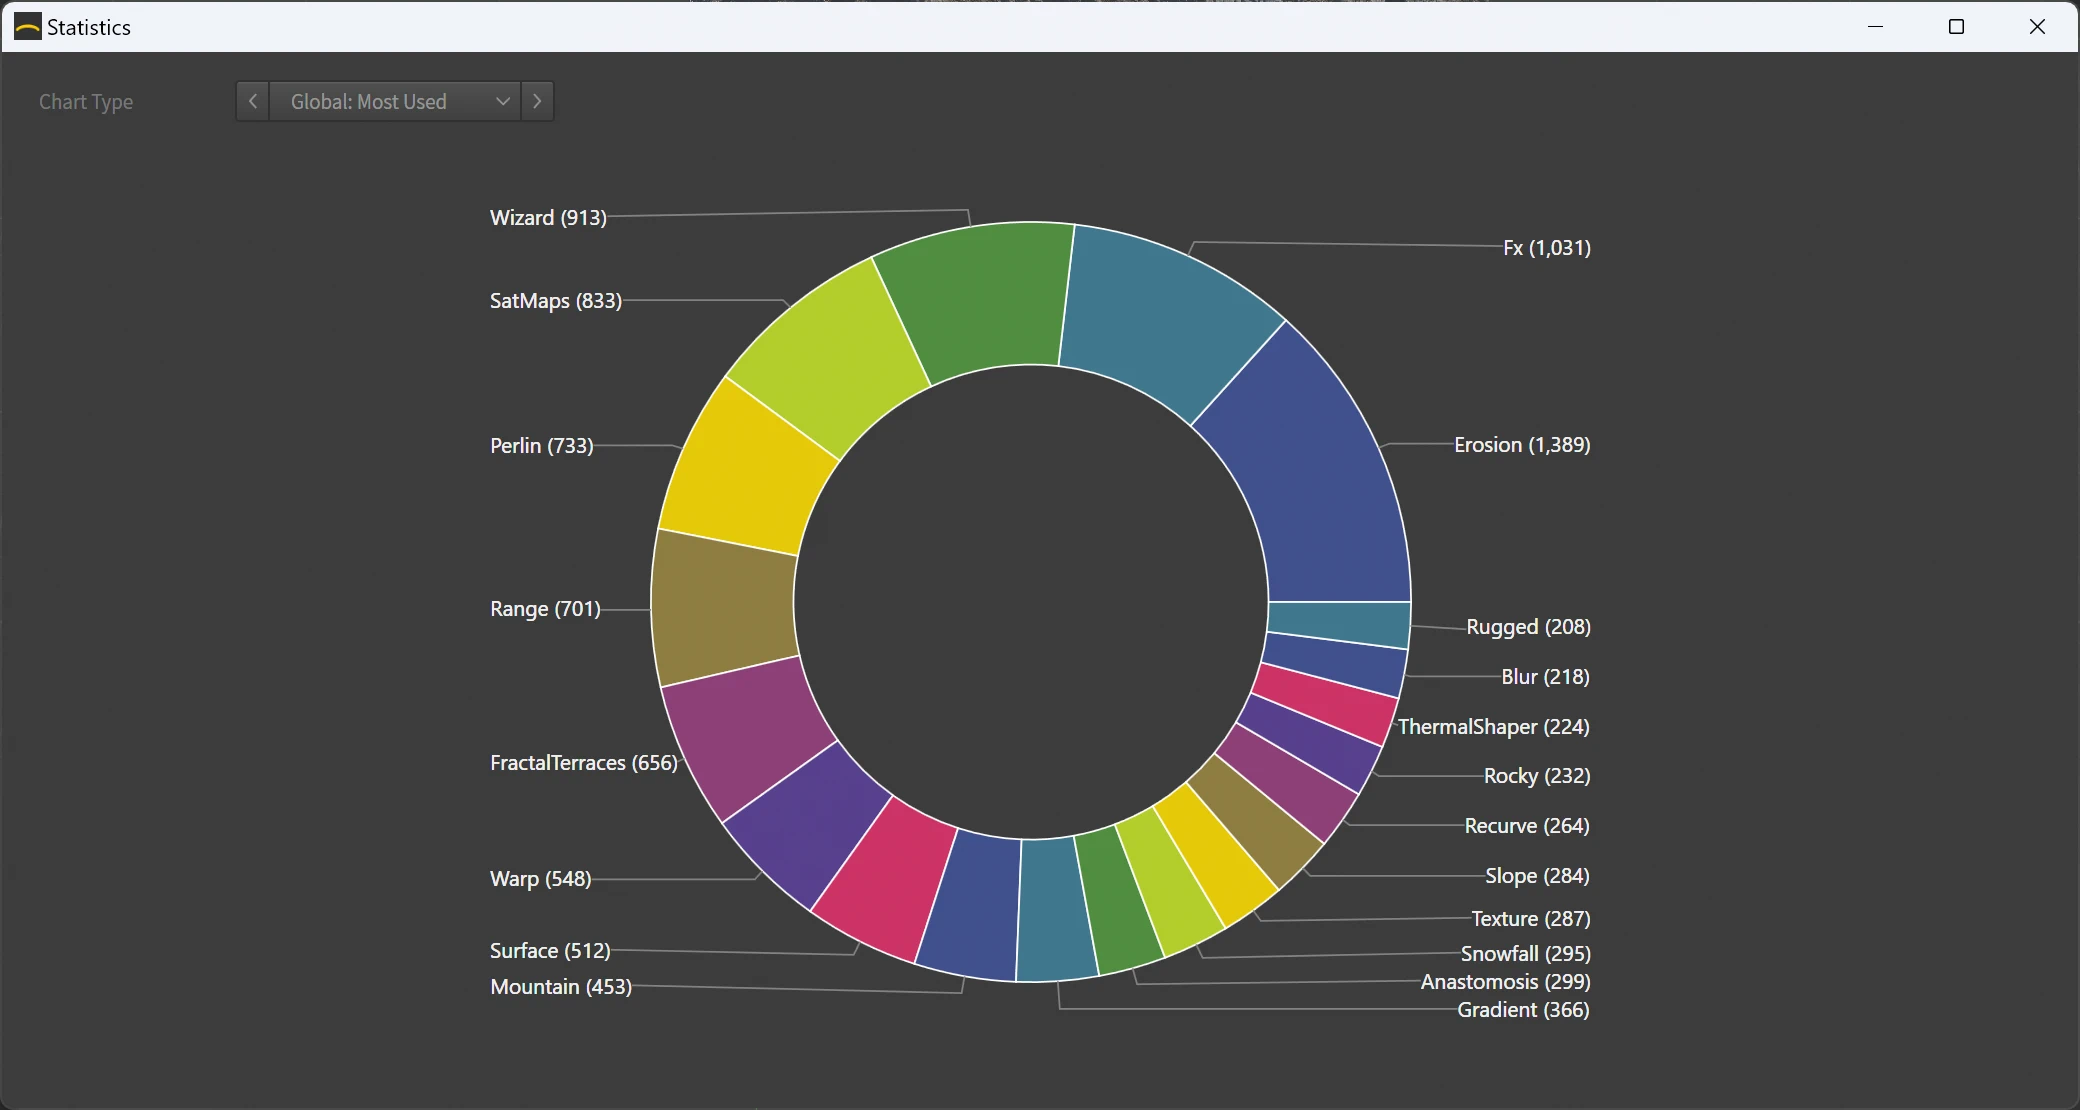
The Build Statistics show the total build time of all currently built nodes. Clicking the button gives you access to detailed statistics for your current graph, which can be very helpful in identifying bottlenecks. Additional pages in the Statistics window let you see your all time usage statistics as learned by the Predictive System.
Cache Size
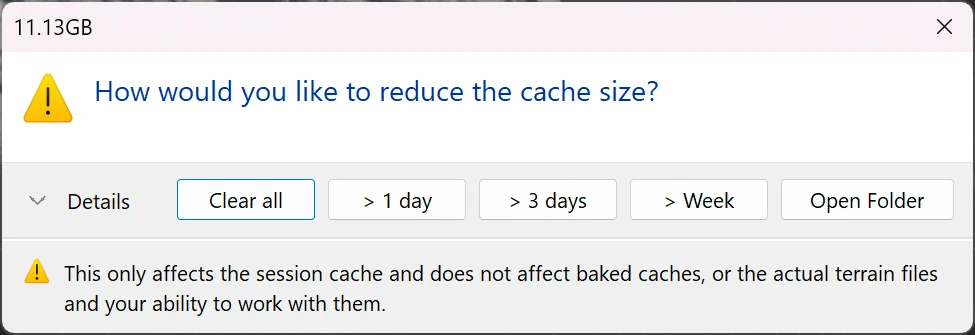
The Cache Size shows the total disk space used by session caches (see Baking and Caching). Clicking the button gives you options to cleanup older caches to recover disk space.
Memory Usage
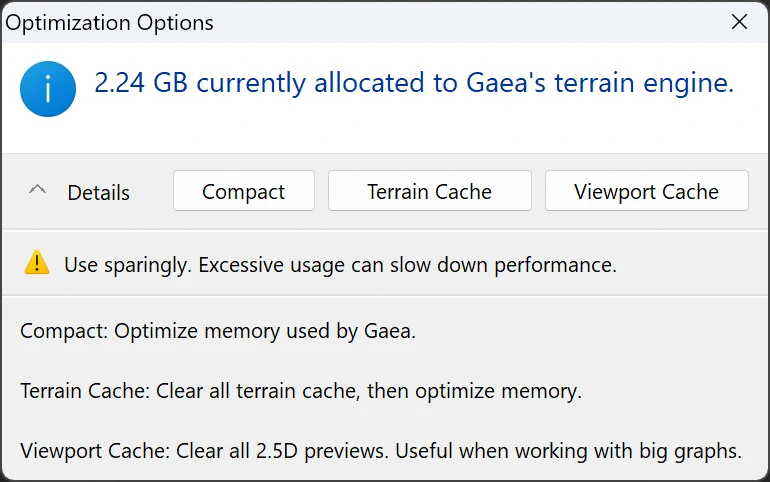
The Memory Usage shows the overall memory used by Gaea for the current terrain. Clicking the button gives you options to optimize the memory manually, or discard different caches to recover memory instantly.

Official Website | Discord | YouTube | Instagram | LinkedIn
This documentation is licensed under the MIT License, a very permissive open-source license.
